Od kako pišem na onom drugom forumu dionica stalno pada.
Vraćam se nazad na ovaj forum da vidim hoće li početi rast.
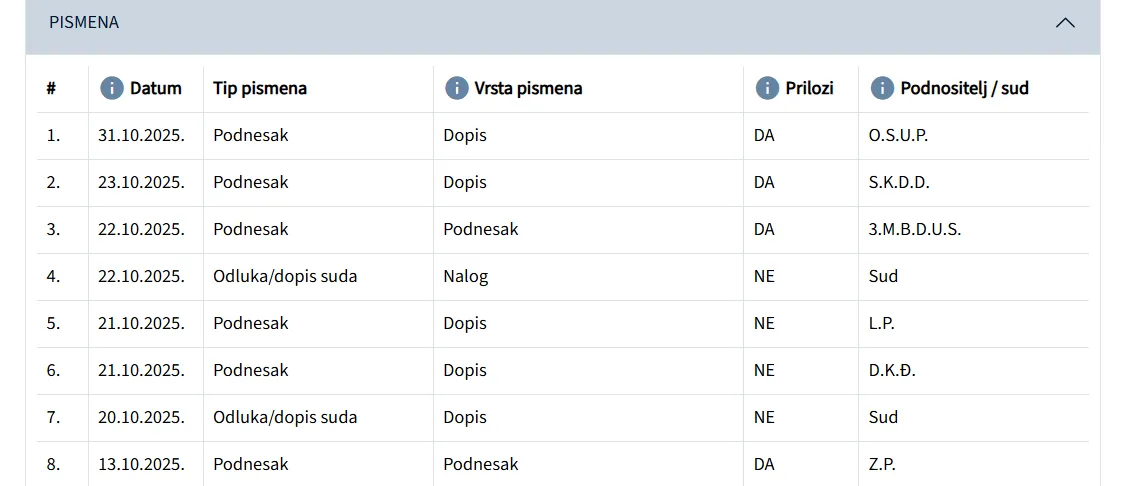
Mislim da je preokret jako blizu jer sud je pri kraju.
Očekuje se odbijajuća presuda..
| Nastavak glavne rasprave | 12.11.2025.09:30 Lokacija: soba 5/II 5/II | Određeno |